DEVELOPMENT OF AN ATLAS OF CANCER IN PUNJAB STATE
Report for the years : 2012 - 2013
Rajiv Gandhi Cancer Institute and Research Centre,
New Delhi
(Centre Code: 541)
|
|
Table 4.24 (a): Summary of Number of Cancers |
|
Year
|
Males
|
Females
|
Total
|
|
2012
|
193
|
185
|
378
|
|
2013
|
158
|
163
|
321
|
|
2012-2013 |
351
|
348
|
699
|
|
Table 4.24 (b): District-wise Distribution of Cancers (2012-2013)
Number (#) and Relative Proportion (%)
|
|
Name of District
(With District Code)
|
2012
|
2013
|
2012-2013
|
|
#
|
%
|
#
|
%
|
#
|
%
|
|
Amritsar (302)
|
61
|
16.1
|
46
|
14.3
|
107
|
15.3
|
|
Ludhiana (309)
|
51
|
13.5
|
43
|
13.4
|
94
|
13.4
|
|
Jalandhar (304)
|
51
|
13.5
|
35
|
10.9
|
86
|
12.3
|
|
Patiala (317)
|
39
|
10.3
|
27
|
8.4
|
66
|
9.4
|
|
Bathinda (314)
|
31
|
8.2
|
22
|
6.9
|
53
|
7.6
|
|
Firozpur (311)
|
20
|
5.3
|
28
|
8.7
|
48
|
6.9
|
|
Gurdaspur (301)
|
25
|
6.6
|
23
|
7.2
|
48
|
6.9
|
|
Sangrur (316)
|
13
|
3.4
|
12
|
3.7
|
25
|
3.6
|
|
Hoshiarpur (305)
|
11
|
2.9
|
13
|
4.0
|
24
|
3.4
|
|
Mohali (318)
|
16
|
4.2
|
7
|
2.2
|
23
|
3.3
|
|
Barnala (320)
|
9
|
2.4
|
12
|
3.7
|
21
|
3.0
|
|
Mansa (315)
|
8
|
2.1
|
12
|
3.7
|
20
|
2.9
|
|
Muktsar (312)
|
6
|
1.6
|
10
|
3.1
|
16
|
2.3
|
|
Kapurthala (303)
|
8
|
2.1
|
6
|
1.9
|
14
|
2.0
|
|
Fatehgarh Sahib
(308)
|
5
|
1.3
|
7
|
2.2
|
12
|
1.7
|
|
Faridkot (313)
|
7
|
1.9
|
4
|
1.2
|
11
|
1.6
|
|
Moga (310)
|
5
|
1.3
|
4
|
1.2
|
9
|
1.3
|
|
SBS Nagar (306)
|
5
|
1.3
|
3
|
0.9
|
8
|
1.1
|
|
Tarn Taran (321)
|
3
|
0.8
|
5
|
1.6
|
8
|
1.1
|
|
Rupnagar (307)
|
4
|
1.1
|
2
|
0.6
|
6
|
0.9
|
|
Total Cases
|
378
|
100.0
|
321
|
100.0
|
699
|
100.0
|
|
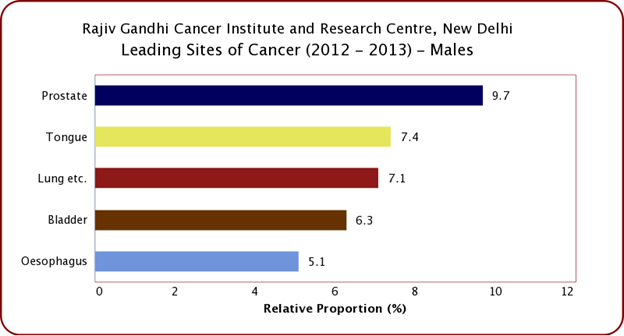
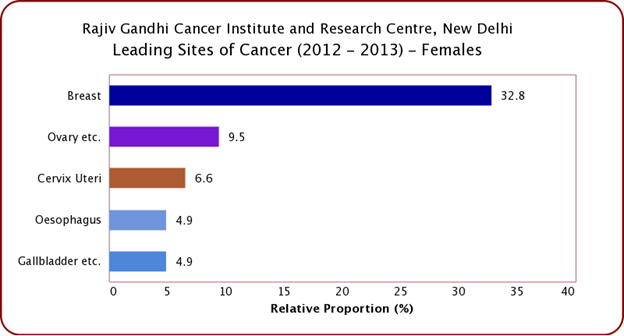
Figure 4.24: Five Leading Sites of Cancer
|
 |
 |
|
|

