DEVELOPMENT OF AN ATLAS OF CANCER IN PUNJAB STATE
Report for the years : 2012 - 2013
Govt. Medical College & Hospital, Chandigarh
(Centre Code: 04001)
|
|
Table 4.23 (a): Summary of Number of Cancers |
|
Year
|
Males
|
Females
|
Total
|
|
2012
|
196
|
252
|
448
|
|
2013
|
185
|
265
|
450
|
|
2012-2013
|
381
|
517
|
898
|
|
Table 4.23 (b): District-wise Distribution of Cancers (2012-2013)
Number (#) and Relative Proportion (%)
|
|
Name of District
(With District Code)
|
2012
|
2013
|
2012-2013
|
|
#
|
%
|
#
|
%
|
#
|
%
|
|
Mohali (318)
|
131
|
29.2
|
123
|
27.3
|
254
|
28.3
|
|
Patiala (317)
|
67
|
15.0
|
66
|
14.7
|
133
|
14.8
|
|
Ludhiana (309)
|
56
|
12.5
|
48
|
10.7
|
104
|
11.6
|
|
Rupnagar (307)
|
44
|
9.8
|
55
|
12.2
|
99
|
11.0
|
|
Fatehgarh Sahib
(308)
|
33
|
7.4
|
41
|
9.1
|
74
|
8.2
|
|
Sangrur (316)
|
25
|
5.6
|
13
|
2.9
|
38
|
4.2
|
|
Hoshiarpur (305)
|
18
|
4.0
|
17
|
3.8
|
35
|
3.9
|
|
Gurdaspur (301)
|
19
|
4.2
|
14
|
3.1
|
33
|
3.7
|
|
SBS Nagar (306)
|
6
|
1.3
|
16
|
3.6
|
22
|
2.4
|
|
Firozpur (311)
|
8
|
1.8
|
10
|
2.2
|
18
|
2.0
|
|
Mansa (315)
|
9
|
2.0
|
8
|
1.8
|
17
|
1.9
|
|
Bathinda (314)
|
5
|
1.1
|
11
|
2.4
|
16
|
1.8
|
|
Jalandhar (304)
|
10
|
2.2
|
4
|
0.9
|
14
|
1.6
|
|
Barnala (320)
|
5
|
1.1
|
8
|
1.8
|
13
|
1.4
|
|
Amritsar (302)
|
5
|
1.1
|
4
|
0.9
|
9
|
1.0
|
|
Other Districts
|
7
|
1.6
|
12
|
2.7
|
19
|
2.1
|
|
Total Cases
|
448
|
100.0
|
450
|
100.0
|
898
|
100.0
|
|
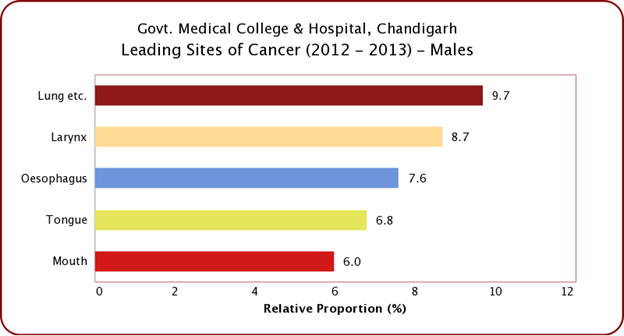
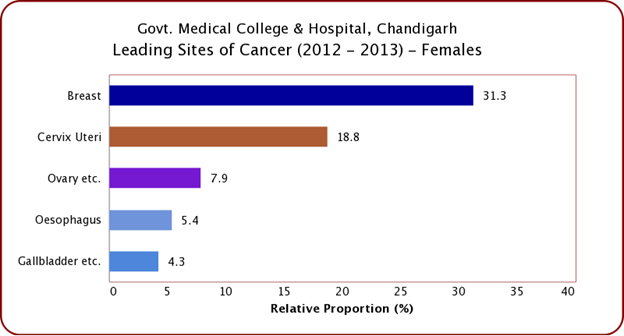
Figure 4.23: Five Leading Sites of Cancer
|
 |
 |
|
|

