DEVELOPMENT OF AN ATLAS OF CANCER IN PUNJAB STATE
Report for the years : 2012 - 2013
PGIMER, Chandigarh
(Centre Code: 539)
|
|
Table 4.21 (a): Summary of Number of Cancers |
|
Year
|
Males
|
Females
|
Total
|
|
2012
|
1004
|
925
|
1929
|
|
2013
|
1092
|
954
|
2046
|
|
2012-2013
|
2096
|
1879
|
3975
|
|
Table 4.21 (b): District-wise Distribution of Cancers (2012-2013)
Number (#) and Relative Proportion (%)
|
|
Name of District
(With District Code)
|
2012
|
2013
|
2012-2013
|
|
#
|
%
|
#
|
%
|
#
|
%
|
|
Mohali (318)
|
390
|
20.2
|
357
|
17.4
|
747
|
18.8
|
|
Patiala (317)
|
239
|
12.4
|
237
|
11.6
|
476
|
12.0
|
|
Rupnagar (307)
|
188
|
9.7
|
218
|
10.7
|
406
|
10.2
|
|
Ludhiana (309)
|
189
|
9.8
|
189
|
9.2
|
378
|
9.5
|
|
Hoshiarpur (305)
|
125
|
6.5
|
161
|
7.9
|
286
|
7.2
|
|
Sangrur (316)
|
114
|
5.9
|
131
|
6.4
|
245
|
6.2
|
|
SBS Nagar (306)
|
89
|
4.6
|
118
|
5.8
|
207
|
5.2
|
|
Jalandhar (304)
|
102
|
5.3
|
93
|
4.5
|
195
|
4.9
|
|
Fatehgarh Sahib
(308)
|
89
|
4.6
|
91
|
4.4
|
180
|
4.5
|
|
Gurdaspur (301)
|
74
|
3.8
|
87
|
4.3
|
161
|
4.1
|
|
Bathinda (314)
|
60
|
3.1
|
61
|
3.0
|
121
|
3.0
|
|
Firozpur (311)
|
51
|
2.6
|
55
|
2.7
|
106
|
2.7
|
|
Mansa (315)
|
36
|
1.9
|
54
|
2.6
|
90
|
2.3
|
|
Amritsar (302)
|
41
|
2.1
|
43
|
2.1
|
84
|
2.1
|
|
Barnala (320)
|
38
|
2.0
|
24
|
1.2
|
62
|
1.6
|
|
Kapurthala (303)
|
28
|
1.5
|
34
|
1.7
|
62
|
1.6
|
|
Moga (310)
|
25
|
1.3
|
37
|
1.8
|
62
|
1.6
|
|
Muktsar (312)
|
24
|
1.2
|
27
|
1.3
|
51
|
1.3
|
|
Other Districts
|
27
|
1.4
|
29
|
1.4
|
56
|
1.4
|
|
Total Cases
|
1929
|
100.0
|
2046
|
100.0
|
3975
|
100.0
|
|
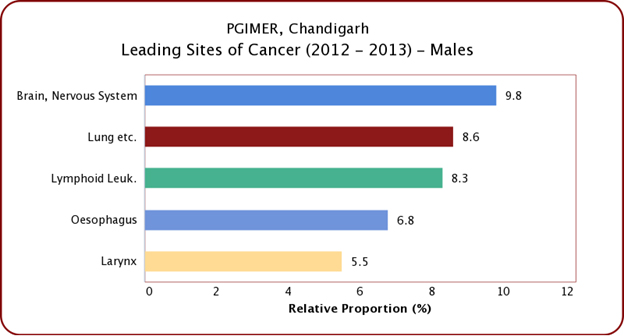
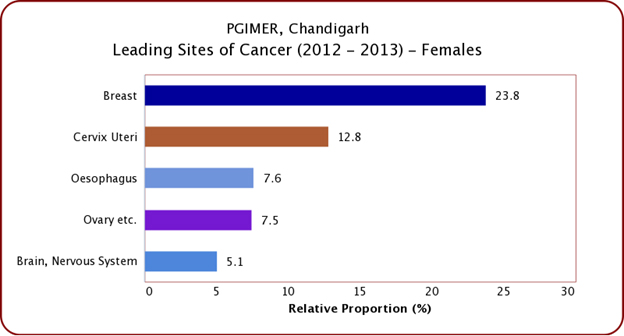
Figure 4.21: Five Leading Sites of Cancer
|
 |
 |
|
|

