DEVELOPMENT OF AN ATLAS OF CANCER IN PUNJAB STATE
Report for the years : 2012 - 2013
Mohan Dai Oswal Multispeciality and Cancer Hospital,
Ludhiana
|
|
Table 4.2 (a): Summary of Number of Cancers |
|
Year
|
Males
|
Females
|
Total
|
|
2012
|
799
|
1001
|
1800
|
|
2013
|
285
|
356
|
641
|
|
2012-2013 |
1084
|
1357
|
2441
|
|
Table 4.2 (b): District-wise Distribution of Cancers (2012-2013)
Number (#) and Relative Proportion (%)
|
|
Name of District
(With District Code)
|
2012
|
2013
|
2012-2013
|
|
#
|
%
|
#
|
%
|
#
|
%
|
|
Ludhiana (309)
|
726
|
40.3
|
453
|
70.7
|
1179
|
48.3
|
|
Jalandhar (304)
|
186
|
10.3
|
6
|
0.9
|
192
|
7.9
|
|
Hoshiarpur (305)
|
113
|
6.3
|
1
|
0.2
|
114
|
4.7
|
|
Kapurthala (303)
|
60
|
3.3
|
50
|
7.8
|
110
|
4.5
|
|
Moga (310)
|
41
|
2.3
|
42
|
6.6
|
83
|
3.4
|
|
Amritsar (302)
|
38
|
2.1
|
42
|
6.6
|
80
|
3.3
|
|
Sangrur (316)
|
72
|
4.0
|
-
|
-
|
72
|
2.9
|
|
Barnala (320)
|
32
|
1.8
|
14
|
2.2
|
46
|
1.9
|
|
Patiala (317)
|
43
|
2.4
|
-
|
-
|
43
|
1.8
|
|
SBS Nagar (306)
|
43
|
2.4
|
-
|
-
|
43
|
1.8
|
|
Gurdaspur (301)
|
36
|
2.0
|
-
|
-
|
36
|
1.5
|
|
Fatehgarh Sahib
(308)
|
35
|
1.9
|
-
|
-
|
35
|
1.4
|
|
Firozpur (311)
|
27
|
1.5
|
-
|
-
|
27
|
1.1
|
|
Bathinda (314)
|
25
|
1.4
|
-
|
-
|
25
|
1.0
|
|
Other Districts
|
72
|
4.0
|
29
|
4.5
|
101
|
4.1
|
|
Cases other than Punjab
|
251
|
13.9
|
4
|
0.6
|
255
|
10.4
|
|
Total Cases
|
1800
|
100.0
|
641
|
100.0
|
2441
|
100.0
|
|
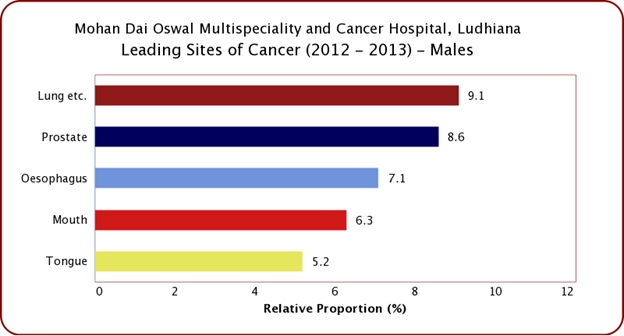
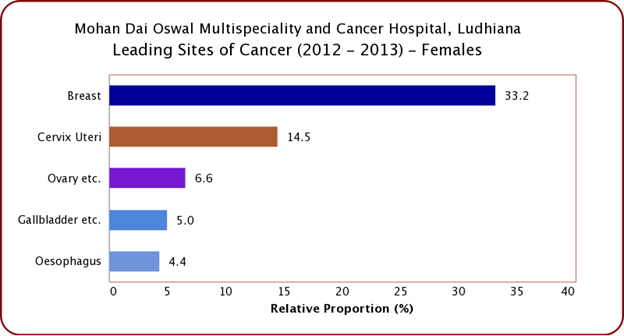
Figure 4.2: Five Leading Sites of Cancer
|
 |
 |
|
|

